Marketing teams have more AI tools than ever, but better tools do not fix weak data. If your customer data sits in separate systems, your tracking is incomplete, or your team measures only clicks and last-touch conversions, AI can optimize the wrong signals very quickly.

That is why first-party data has moved from a technical project to a core marketing job in 2026. On September 10, 2026, Google announced new measurement updates that expand Data Manager into Google Analytics and Display & Video 360, add a Data Strength Uplift metric in Google Ads, and extend Meridian with new capabilities for measuring real-world impact. The direction is clear: brands need cleaner owned data, better signal quality, and stronger causal measurement.
This guide shows how to build that foundation in a practical way. You do not need a huge data team. You need a clear plan for what to collect, how to connect it, what to measure, and how to protect user trust.
What First-Party Data Means in 2026
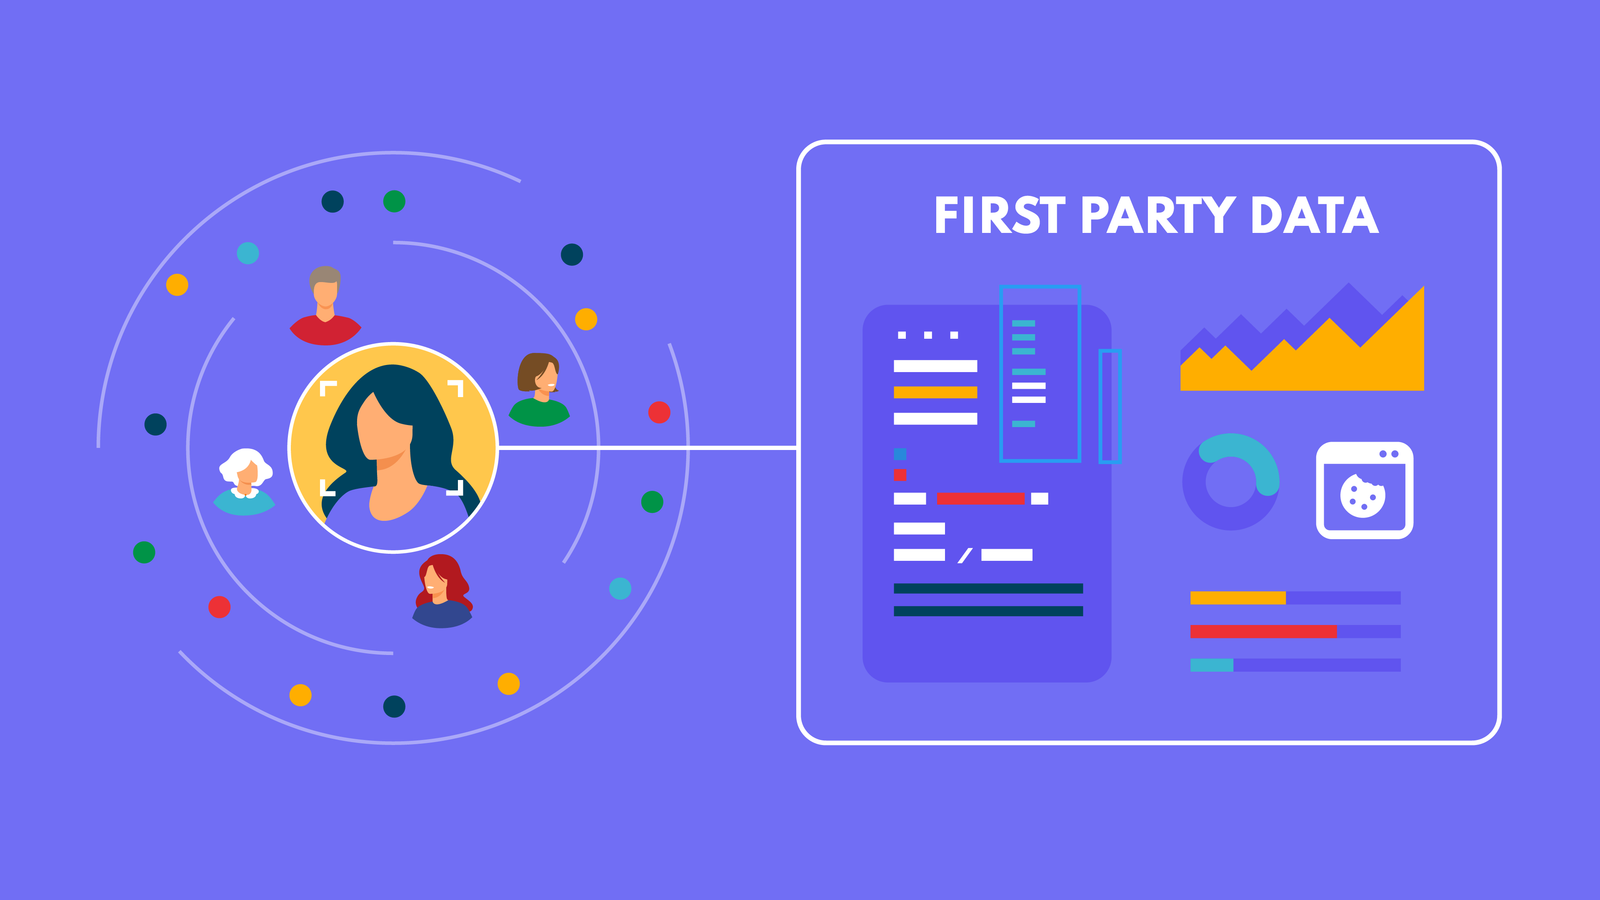
First-party data is information your business collects directly from people who interact with you. That can include website visitors, customers, subscribers, app users, leads, and support contacts.
Useful first-party data may include purchase history, email sign-ups, form submissions, product views, account activity, loyalty activity, customer preferences, support outcomes, and campaign engagement. It can also include consent choices and the source that brought a person to your business.
The important word is directly. You are not buying this data from an unknown broker. The customer has interacted with your business, and your systems collected the information within the rules and permissions that apply to that interaction.
Why it matters more now
AI-based advertising systems make decisions from signals. If your inputs are weak, those systems may still find patterns, but the patterns may not match your real business goals.
Imagine an online software company that treats every free-trial registration as an equal conversion. One campaign may produce 500 trial users who never activate the product. Another may produce 220 users, but 80 of them become paying customers. A system trained only on trial volume may push more budget toward the first campaign.
A better first-party setup passes deeper outcomes back into the measurement system. The platform can then learn that activation, subscription, retention, or qualified revenue matters more than a simple form completion.
Start With the Business Question, Not the Tool
Many teams start by asking which customer data platform, analytics tool, or AI marketing product they should buy. Reverse that order.
Start with one business question. For example:
- Which campaigns create profitable customers, not just leads?
- Which audience groups renew after 90 days?
- Which content helps prospects move from research to demo request?
- Which channels create demand that later converts through another channel?
- Which marketing activity adds sales that would not have happened anyway?
Once the question is clear, list the minimum signals needed to answer it. This prevents a common problem: collecting a large amount of data that nobody can use.
A realistic example
Suppose a home-services company runs Google Ads, Meta campaigns, local SEO, and email marketing. Its real goal is not form submissions. It wants completed jobs with healthy margins.
The company could connect these stages:
- Ad click or organic visit.
- Quote request.
- Qualified lead.
- Booked appointment.
- Completed job.
- Revenue and margin.
That sequence gives the marketing team a much better optimization target than “leads.” It also gives finance and marketing one shared definition of success.
Build a Simple First-Party Data Map

Before changing tracking, create a one-page data map. It should show where customer data starts, where it moves, and where it is used.
Step 1: list collection points
Write down every place where people give you information or create useful behavioral data. Common examples include website forms, checkout pages, newsletter forms, CRM records, app registrations, support systems, point-of-sale systems, event registrations, and loyalty programs.
Step 2: mark the system of record
Choose which system is trusted for each important fact. Your CRM may be the source for lead status. Your billing platform may be the source for paid revenue. Your analytics tool may be the source for page behavior. Do not let three systems claim to be the final source for the same metric.
Step 3: define a shared customer key
You need a privacy-safe way to connect events that belong to the same customer or account. Depending on your setup, this may use an internal customer ID, account ID, transaction ID, or properly handled hashed identifiers. Avoid placing raw personal information in analytics fields that are not designed for it.
Step 4: document consent and allowed use
Record what users agreed to and which systems may use the data. Your privacy policy, consent banner, tag setup, CRM workflow, and advertising integrations should not contradict one another.
Improve Signal Quality Before You Add More Signals
More data is not automatically better. Ten duplicate events can be worse than one clean event.
Audit your high-value events first. Confirm that each event fires once, carries the right parameters, uses consistent naming, and represents a real business action.
Use a practical event hierarchy
Separate events into three levels:
- Behavior signals: page views, video plays, product views, scrolls, downloads.
- Intent signals: pricing-page visits, comparison views, quote starts, cart additions, demo requests.
- Outcome signals: qualified lead, completed purchase, subscription, renewal, booked service, revenue.
AI bidding and audience systems should receive outcome signals where possible. Behavior signals are useful for diagnosis and audience understanding, but they should not automatically become primary conversion goals.
Use Google Data Manager as a Connection Layer, Not a Strategy
Google’s September 2026 measurement update expands Data Manager into Google Analytics and Display & Video 360. For teams already using Google’s stack, this can reduce the work needed to connect first-party signals across products.
But the tool does not decide which business outcome matters. Your team still needs to define the conversion hierarchy, data ownership, privacy rules, and quality checks.
What to connect first
Start with the smallest data set that can change decisions:
- Confirmed purchases and transaction values.
- Qualified leads instead of all leads.
- Subscription upgrades or renewals.
- Offline sales that started online.
- Customer segments that reflect actual value.
Do not rush to connect every field in your CRM. A smaller, reliable feed is easier to test and govern.
Measure Data Strength With Business Outcomes
Google’s new Data Strength Uplift metric is designed to help advertisers understand the value created by improving their first-party data foundation. That is useful, but marketers should still keep their own scorecard.
A simple internal scorecard can track four areas:
- Coverage: What percentage of valuable customer outcomes can be connected back to marketing?
- Accuracy: Are duplicate, missing, or incorrectly labeled events under control?
- Freshness: How quickly do offline or CRM outcomes reach your measurement systems?
- Usefulness: Does the data actually change bidding, budgeting, targeting, creative, or retention decisions?
A team with 70% reliable coverage may make better decisions than a team claiming 98% coverage built on inconsistent or duplicated signals.
Move Beyond Last-Click Attribution

Last-click attribution is easy to read, which is why teams keep using it. It is also incomplete for many buying journeys.
A person may discover a brand through a LinkedIn post, search the brand later, read two guides, join an email list, return through a paid search ad, and finally book a demo. Giving all credit to the final ad hides the role played by earlier touchpoints.
Use three measurement views together
For a more useful picture, combine:
- Platform and analytics reporting for fast daily optimization.
- Experiments and incrementality tests to estimate what marketing actually caused.
- Marketing mix modeling for broader budget planning across channels and time.
Google’s open-source Meridian project is one option for marketing mix modeling. In 2026, Google has continued extending Meridian and its measurement suite, including work designed to connect media activity with real-world outcomes.
Create a Measurement Plan for Small and Mid-Sized Businesses
You do not need enterprise software to improve measurement. A lean setup can work well if each layer has a clear job.
Layer 1: website and app measurement
Track the actions that explain the customer journey. Keep naming simple. Test key events after site changes. Document what each event means so future team members do not guess.
Layer 2: CRM and revenue outcomes
Make sure lead status, deal status, revenue, refunds, and renewals are updated consistently. Bad CRM hygiene turns into bad marketing data.
Layer 3: privacy and consent
Use a consent process that matches the laws and markets relevant to your business. Store consent choices where needed. Review tags and third-party scripts regularly rather than treating the consent banner as a one-time project.
Layer 4: campaign activation
Send only approved, useful signals to ad and marketing platforms. Build audiences around real needs, such as existing customers, high-value users, or people who have shown meaningful intent.
Layer 5: business reporting
Create a short executive view. Include spend, qualified outcomes, revenue, contribution margin where available, customer acquisition cost, and a small number of leading indicators.
Do Not Confuse Personalization With Surveillance

First-party data can improve customer experience, but only when the use feels reasonable.
A useful personalization example is remembering a customer’s preferred product category and showing relevant recommendations after the customer signs in. A poor example is combining unrelated data sources to infer sensitive traits that the person never expected you to use.
Use a simple rule: if explaining the data use in one clear sentence would make your team uncomfortable, rethink it.
How AI Should Use Your Marketing Data
AI is most useful when it works inside clear boundaries. Give it reliable signals and a specific objective.
For campaign optimization, the objective may be qualified revenue within an acceptable acquisition cost. For email, it may be repeat purchase without increasing unsubscribe rates. For content, it may be qualified organic visits that reach product or lead-generation pages.
Do not ask AI to “maximize performance” without defining performance. A vague goal encourages proxy metrics such as clicks, cheap leads, or high engagement even when those signals do not create business value.
A 30-Day First-Party Data Action Plan
Week 1: audit
List your customer data sources, key conversion events, ad platforms, analytics tools, and consent mechanisms. Identify duplicate events and missing revenue signals.
Week 2: prioritize
Select three to five outcomes that matter most. Define one owner for each. Decide which system is the source of truth.
Week 3: connect and test
Connect the highest-value CRM or transaction outcomes to your analytics and advertising workflow where appropriate. Test with real records and compare platform counts with source systems.
Week 4: evaluate
Review whether the new data changed a real decision. Did a campaign look weaker after judging it by qualified revenue? Did a channel previously undervalued by last-click show stronger influence in experiments or broader modeling? Use those findings to set the next improvement.
Common Mistakes to Avoid
- Collecting everything: more fields create more governance work and often add little value.
- Optimizing to shallow events: a click, scroll, or basic form fill may not represent business success.
- Ignoring offline outcomes: businesses with phone, store, sales-team, or service transactions can miss a large part of the journey.
- Trusting one attribution model: use multiple measurement methods for important budget decisions.
- Skipping data quality checks: AI cannot reliably repair inconsistent source data after the fact.
- Treating consent as legal copy only: consent choices must match technical behavior.
Before scaling the setup, run one final reconciliation between your CRM, analytics platform, and advertising reports. If the same business outcome is counted differently across systems, document the reason and choose one source of truth for decision-making.
Final Takeaway
The best first-party data strategy for 2026 is not the one with the largest database. It is the one that gives your marketing systems a smaller set of accurate, permissioned, business-relevant signals.
Start with the outcome you want to improve. Map the data needed to understand that outcome. Fix quality issues before adding new tools. Connect deeper CRM and revenue signals where they are useful. Then use experiments, analytics, and broader models to judge whether marketing is creating incremental business value.
AI can make decisions faster, but your team must still decide what a good decision looks like. Build that definition into your data foundation, and the rest of your measurement stack becomes far more useful.